Fluorescence Lifetime Imaging Ophthalmoscopy (FLIO)
Overview of Data Domain
FLIO stands for Fluorescence Lifetime Imaging Ophthalmoscopy, a technology used to capture and analyze fluorescence behavior in the eye over time. It is based on a concept called fluorescence decay, which refers to the process by which fluorescent molecules lose their excitation energy and return to their ground state, emitting light in the form of fluorescence. When a fluorescent molecule absorbs light energy, it becomes excited and emits light of a longer wavelength as it returns to its ground state. The time it takes for this emission to occur, along with the intensity of the emitted light, provides valuable information about the molecular environment and dynamics. Understanding fluorescence decay is crucial for interpreting FLIO data, as it informs about the lifetime and behavior of fluorescent signals within the eye.
During the imaging, the FLIO device exposes retinal tissue to intermittent laser beams and records the timing and number of photons for each point after each laser pulse. This information forms a picture of how fluorescence behaves over time in different parts of the eye. When analyzing FLIO data, it is important to understand that each pixel in the image contains a curve showing how many photons arrived at different times. This photon data follows Poisson distribution. The signal-to-noise ratio varies for different aspects of the data. Additionally, unwanted signals, like background light or fluorescence from the lens, can not simply be subtracted because they are part of the same distribution as the useful data. Our FLIO scan records images using two wavelengths, short (498-560nm) and long (560-720nm), which are provided in two different .dcm files for each eye in the dataset. These wavelengths provide different penetrance into the retinal tissue and usage of short- or long-wavelength .dcm file can be based on the region and layer of interest. A common approach is analyzing each of these files separately for each subject.
To get the best FLIO data, it is crucial to maximize the number of photons recorded by ensuring proper focus and avoiding unwanted signals like background light or lens fluorescence. Keeping a consistent distance between the scanner and the patient during data collection is also important for accurate results. These are particularly important when working with the data because the device is very sensitive, and several factors can induce noise in the images. The device can not handle more than 1 centimeter of movement during image acquisition. More information can be found here:
- https://www.ncbi.nlm.nih.gov/books/NBK554053/
- https://www.becker-hickl.com/?gad_source=1&gclid=Cj0KCQjwiMmwBhDmARIsABeQ7xT-8Pj-NiWT2U6vOZNo1QYX7r1J7Bp3TF_9uv6Pgum2oW_sB7X7iuQaAmAcEALw_wcB
Data Analysis
For data analysis, areas of interest are divided into bins to reduce noise and provide quantitative measures. Examples are binning macular, foveal, and pathologic areas. Another useful binning approach in ophthalmology is using a standard Early Treatment Diabetic Retinopathy Study (ETDRS) grid. After defining the bins, the mean fluorescence lifetime (τm) can be calculated from a 3-exponential approximation of the fundus autofluorescence decays. The τm then can be compared between the bins themselves or across groups of patients using statistical methods. Furthermore, τm can be calculated, overlaid, and plotted on a heatmap to get an image representation of the analysis, allowing visual evaluation of the morphology and distribution of areas with certain pathologies.
The analysis can be done using available software, including SPCImage (Becker & Hickl GmbH, Berlin, Germany), FluoFit (PicoQuant GmbH, Berlin, Germany), SymPhoTime (PicoQuant GmbH, Berlin, Germany), LifExplorer (Heidelberg Engineering, Heidelberg, Germany), MATLAB, FLIO reader (ARTORG Center for Biomedical Engineering Research, Bern, Switzerland), FLIMX (Biophotonics and Imaging Laboratory at the University of Tübingen, Tübingen, Germany). The analysis can also be conducted using available Python libraries: FLIMLib and FLIMfit.
Overview of AI-READI Retinal Photography Data
Overview of available images
| Manufacturer | Manufacturers Model Name | Laterality | Wavelength | Height | Width | Number of Frames |
|---|---|---|---|---|---|---|
| Heidelberg | FLIO | R or L | Short-wavelength or Long-wavelength | 256 | 256 | 1024 |
Short-wavelength (498-560nm), Long-wavelength (560-720nm
Example images
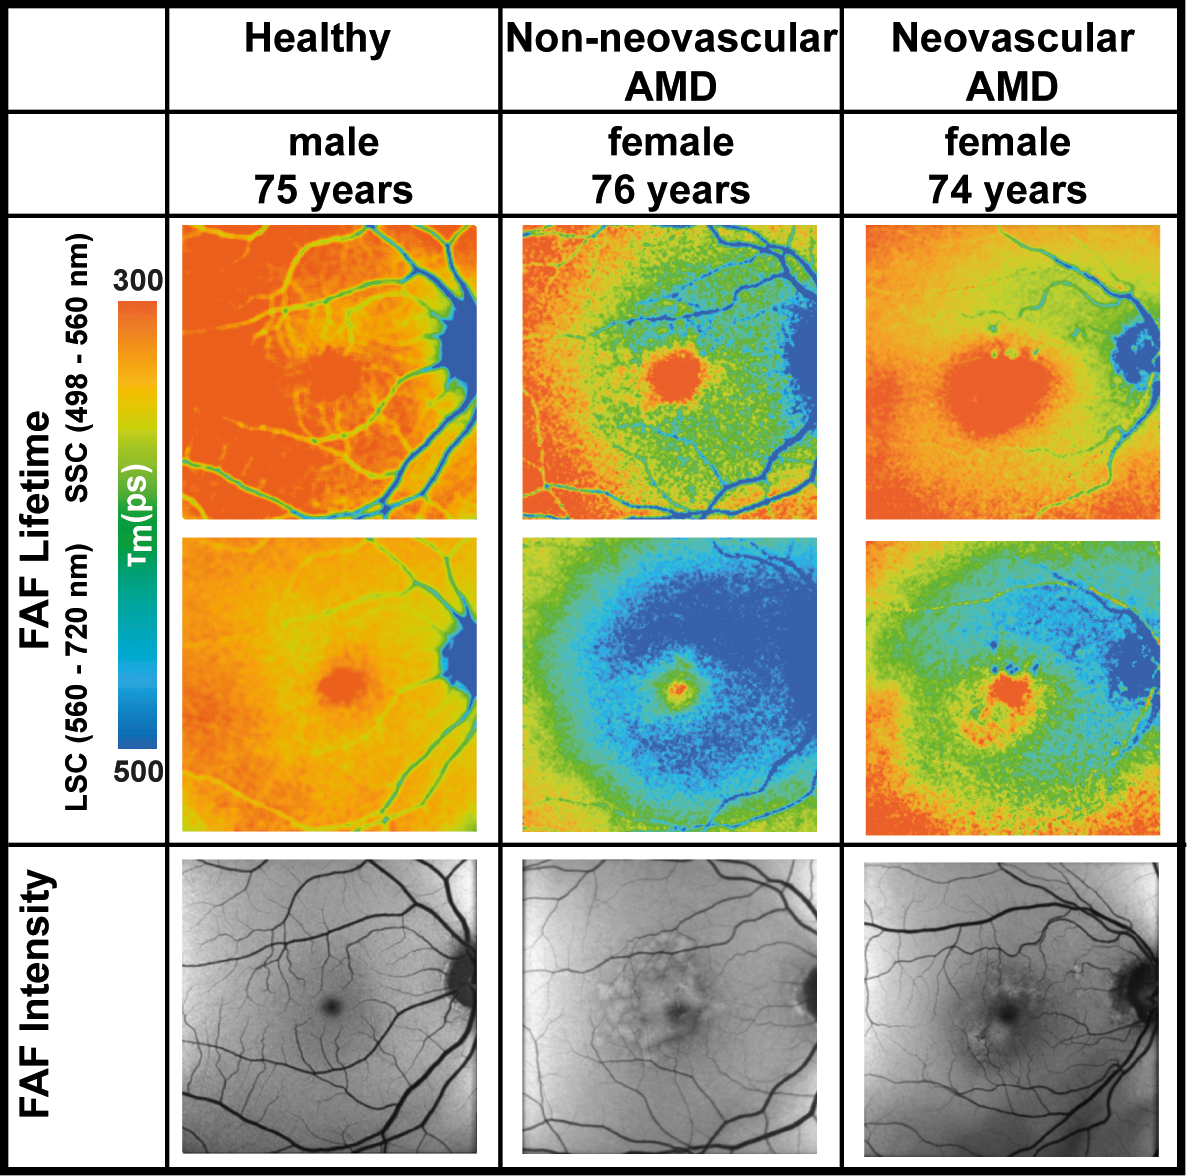
Figure 1. Demonstrating outputs of Fluorescence Lifetime Imaging Ophthalmoscopy in eyes with
age-related macular degeneration. These images are preprocessed, overlaid, and plotted as a
heatmap. FAF: fundus autofluorescence, AMD: age-related macular degeneration, SSC: short
spectral channel, LSC: long spectral channel. The image is used with permission from Lydia
Sauer, Christopher B. Komanski, Alexandra S. Vitale, Eric D. Hansen, and Paul S. Bernstein from
their study titled Fluorescence Lifetime Imaging Ophthalmoscopy (FLIO) in Eyes With Pigment Epithelial Detachments Due to Age-Related Macular Degeneration, published in Invest.
Ophthalmol. Vis. Sci. 2019;60(8):3054-3063, DOI:
https://doi.org/10.1167/iovs.19-26835.
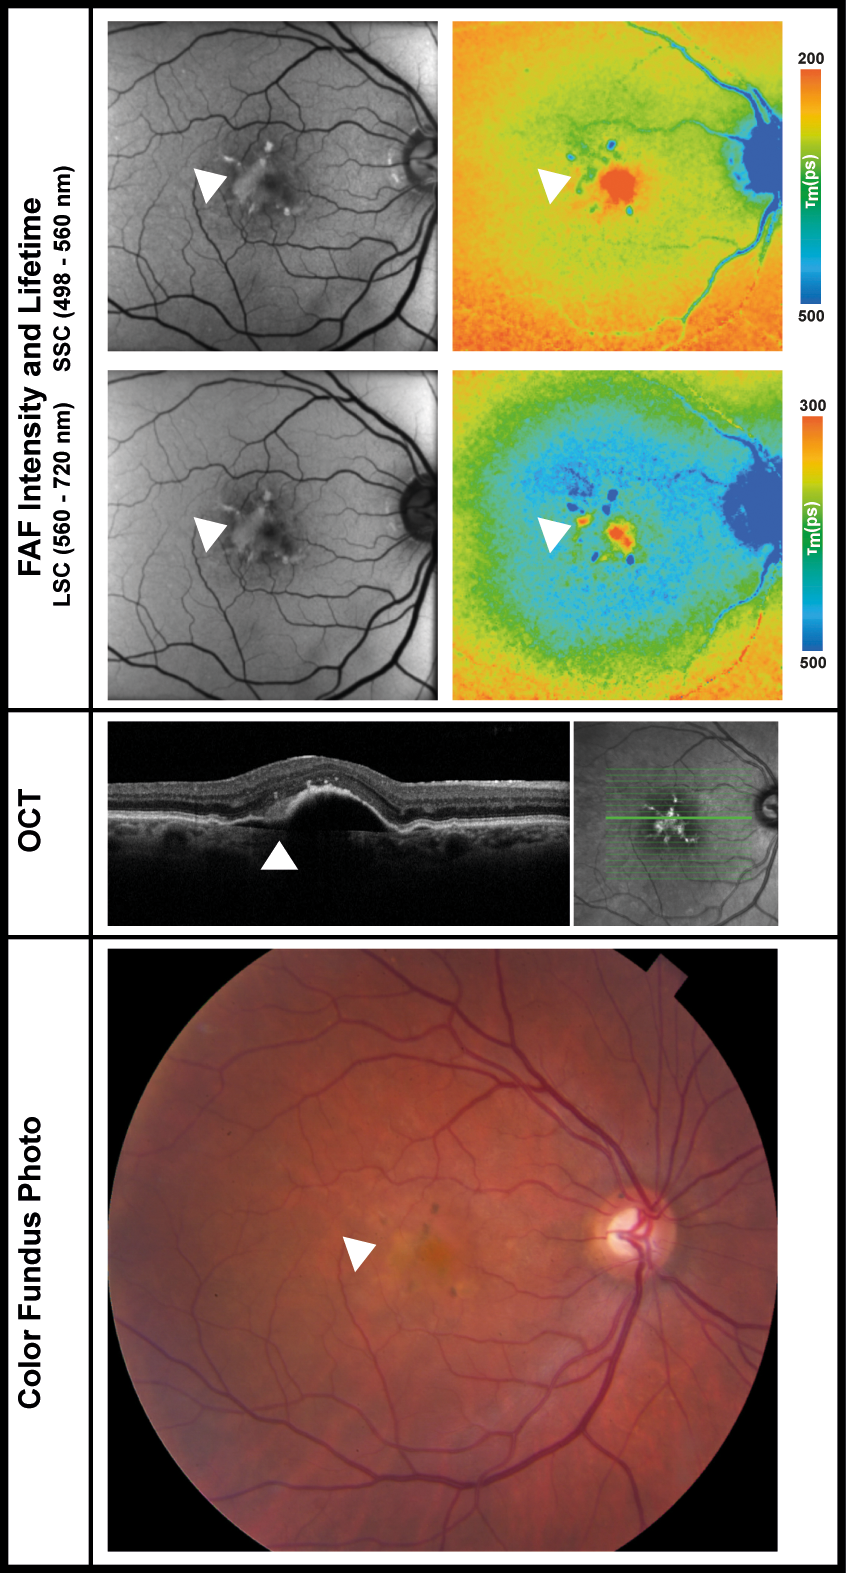
Figure 2. Fundus autofluorescence and lifetime images from short- and long-spectral channels of
an eye with subretinal hyperreflective material, which is indicated using white arrows. The
image is used with permission from Lydia Sauer, Christopher B. Komanski, Alexandra S. Vitale,
Eric D. Hansen, and Paul S. Bernstein from their study titled Fluorescence Lifetime Imaging Ophthalmoscopy (FLIO) in Eyes With Pigment Epithelial Detachments Due to Age-Related Macular Degeneration, published in Invest. Ophthalmol. Vis. Sci. 2019;60(8):3054-3063,
https://doi.org/10.1167/iovs.19-26835.
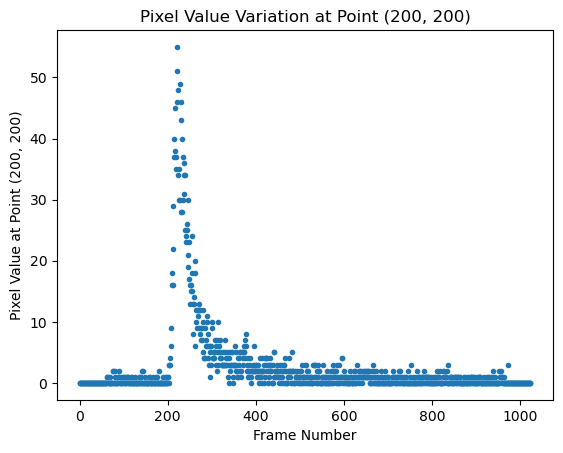
Figure 3. Depiction of the plotting of the recorded value for a single pixel (200, 200) over time, using different frames within the pixel array of the .dcm file of an AI-READI subject
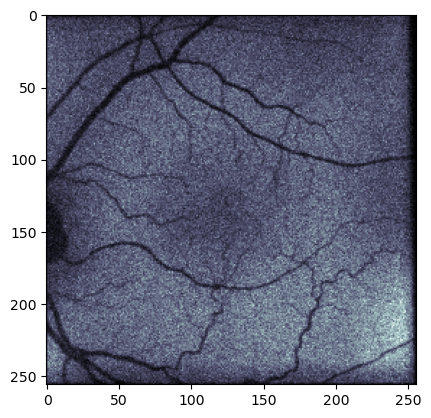
Figure 4. Illustration of the plotting of a single frame from the pixel array in a .dcm file from an AI-READI subject without preprocessing. This particular frame represents the frame with the highest signal amplitude (frame number 215 in this case). Each pixel corresponds to a captured fluorescence photon count from the corresponding point in the retina. The .dcm file can be preprocessed to generate the heatmap-style figures used in the literature.
Data processing
-
File Format: DICOM
-
Data standards
Currently there are no SOP Classifications for FLIO in DICOM, as this is a relatively new technology. To reflect this, 1.2.840.10008.5.1.4.1.1.77.1.5.xxxxx was used as the value of SOP Class UID.
-
File processing
One FLIO scan produces one html file and sdt file. Based on the information from files, two DICOM files (short and long wavelength, respectively) were created per scan. Private tags are used to represent values that are not defined by traditional DICOM tags. Private tags 0073100X were used to encode the information from the corresponding HTML file and private tags 0075100X were used to encode the information from the corresponding SDT file. The pixel array was extracted from the same sdt file and included in the resulting DICOM file.
Metadata Example
DICOM Tags and values (this represents a subset of the available tags)
| Tag | Element Name | Value Example |
|---|---|---|
| 00100020 | Patient ID | 0000 |
| 00100040 | Patient Sex | M |
| 00080070 | Manufacturer | Heidelberg Engineering |
| 00081090 | Manufacturer Model Name | FLIO |
| 00181000 | Device Serial Number | 3F0013 |
| 00280002 | Samples Per Pixel | 1 |
| 00280004 | Photometric Interpretation | MONOCHROME2 |
| 00280010 | Rows | 256 |
| 00280011 | Columns | 256 |
| 00280100 | Bits Allocated | 16 |
| 00280101 | Bits Stored | 16 |
| 00280103 | Pixel Representation | 0 |
| 00280008 | Number Of Frames | 1024 |
| 00280002 | Samples Per Pixel | 1 |
| 00280004 | Photometric Interpretation | MONOCHROME2 |
| 00280103 | Pixel Representation | 0 |
| 00080033 | Content Time | 153554.000 |
| 00080023 | Content Date | 20230808 |
| 00200062 | Image Laterality | L |
| 00080016 | SOP Class UID | 1.2.840.10008. 5.1. 4.1.1.77.1.5.xxxxx |
| 00080018 | SOP Instance UID | 1.2.826.0.1 .3680043.8.498.13 108756386123948 2566643757494 04023032 |
| 00081030 | Study Description | Long Wavelength 560nm - 720nm |
| 00181030 | Protocol Name | fluorescence lifetime imaging ophthalmoscopy |
| 7FE00010 | Pixel Data |
Private tags Information
| Tag | Element Name | |
|---|---|---|
| 00730010 | Group Information | FLIO HTML information |
| 00731001 | Focus | 0.09dpt |
| 00731002 | Cam S/N | 15362 |
| 00731003 | Pws S/N | 20320 |
| 00731004 | Version | FLIO.TAUMAP v1.6.5 |
| 00731005 | Scan Duration (second) | 186 |
| 00731006 | Note | Dual Detector Mode |
| 00731007 | Minimal Photons Per Pixel | 0 |
| 00731008 | Maximal Photons Per Pixel | 10074 |
| 00731009 | Number of photons Per Pixel | 4060 |
| 0073100A | Processed frames | 1580 |
| 0073100B | Number of Valid Photons Per Frame | 185184 |
| 0073100C | Number of Invalid Photons Per Frame | 0 |
| 00750010 | Group Information | FLIO SDT information |
| 00751001 | Model Serial Number | 3F0406 |
| 00751002 | Measurement Mode | 9 |
| 00751003 | cfd_ll (CFD Limit Low in mV) | -50.9803924560546 |
| 00751004 | cdf_lh (CFD Limit High in mV) | 80.0 |
| 00751005 | cfd_zc (CFD Zero Cross Level 1 in mV) | 12.850393295288086 |
| 00751006 | cfd_hf (CDF Hold off in mV) | 5.0 |
| 00751007 | syn_zc (Sync Zero Cross in mV) | -19.65354347229004 |
| 00751008 | syn_fd (Sync Freq Divider in mV) | 1 |
| 00751009 | syn_hf (Sync Holdoff in mV) | 4.0 |
| 0075100A | tac_r (TAC Range in seconds) | 5.0033573728569536e-08 |
| 0075100B | tac_g (TAC Gain) | 4 |
| 0075100C | tac_of (TAC offset) | 7.450980186462402 |
| 0075100D | tac_ll (TAC limit low) | 5.098039150238037 |
| 0075100E | tac_lh (TAC limit high) | 94.90196228027344 |
| 0075100F | adc_re (ADC resolution) | 1024 |
| CFD | Constant Fraction Discriminator |
| SYN | Synchronization |
| TAC | Time-to-Amplitude |
| ADC | Analog-to-Digital Converter |